Response of Biological Activities to Tropical Cyclones
Typhoon landfall may devastate the economy and cause human lives. Yet typhoon may also enhance other form
of life - the primary biological productivity in the ocean. Ocean productivity affects not only the
local fishery, but also the uptake of carbon dioxide, an important greenhouse gas, and a major
cause of natural and man-made cliimate changes.
Documenting the biological response to the passages of typhoon using ships with prescribed tracks, or
using moored buoys with fixed location, is difficult because of the transient and servere nature of the
typhoons. Two spaceborne microwave sensors, QuikSCAT and the Tropical Rain Measuring Mission (TRMM)
Microwave Imager (TMI) allow us to measure ocean surface wind vectors, and sea surface temperature (SST)
under the cloud cover of typhoons, day and night. The Sea Viewing Wide-Field-of-View Sensor (SeaWiFS) shows
us the biological activities through ocean color, after the typhoon passage. Together the three sensors reveal the
fertilization of the sea by Typhoon Kai-Tak; such revelation may have significant implication to
our understanding of the global carbon cycle and climate changes.
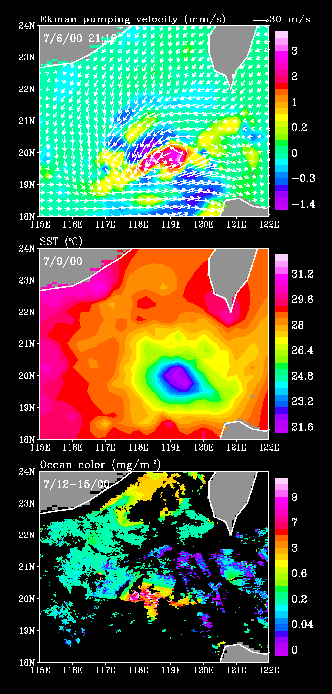
QuikSCAT observed typhoon Kai-Tak lingering for several days in the northern part of South China Sea (SCS)
between 5th to 8th July 2000. There is a sharp increase of Ekman pumping velocity, (the vertical velocity
resulted from wind induced surface convergence and uplifting of the thermocline) computed from
QuikSCAT winds, during the passage of Kai-Tak (Fig. 1a). The sea surface surface temperature dropped
from 30degree C before the typhoon to 22 degree C the day after the typhoon departure, a drastic 8 degree drop as revealed
by TMI in Fig. 1b. SeaWiFS showed 300 time increase (from 01 to 30 mg/m^2) in chlorophyll-a
(indicating biological activities) within a few days (Fig. 1c).
Integrated over the period and the area of the biological bloom, the Kai-Tak passage was found to
generate 2-4% of the annual new production on SCS.

Caption:
Figure 1: The effects of Typhoon Kai-Tak as, (a) wind vector (white arrows) superimposed on the
color image of Ekman pumping velocity on July 8, 2000; (b) sea surface temperature observed by
TMI on July 9, 2000; and (c) composite map of ocean color observed by SeaWiFS July 12-15, 2000.
Reference:
Lin, I-I and W.T. Liu, Proc. 12th Conf. Satellite Meter., 42, 227-239, 2003.
|


