|

Oceanic Thermal and Biological Responses to Santa Ana Winds
Abstract:
Ocean surface wind vectors with improved spatial resolutions were
derived from the National Aeronautics and Space Administration's
(NASA's) Quick Scatterometer (QuikSCAT) satellite. They allow us to
examine the details and extent of oceanic influence of a Santa Ana
event - a strong offshore and downslope wind in southern California
that may spread wide fires, damage properties, and endanger aviation.
The oceanic thermal and biological responses to the surface wind jets
were observed with other spaceborne sensors. It is found that surface
wind jets reduce sea surface temperatures and increase biological
productivities. Spacebased measurements demonstrate the inadequacy
of current operational numerical weather prediction (NWP) models to
accurately and consistently predict the characteristics of Santa Ana
winds over the coastal ocean.
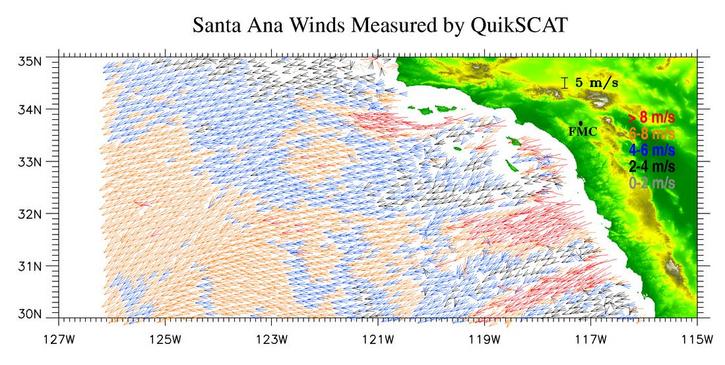
Figure 1. Ocean surface winds measured by QuikSCAT at 13:25UT, February
10, 2002. Data are at 12.5-km resolutions. Observations within 15 km
of coastlines were not used in this study. The color scale indicates
the magnitude of wind speed. The location of the weather station FMC
is labeled on the plot.
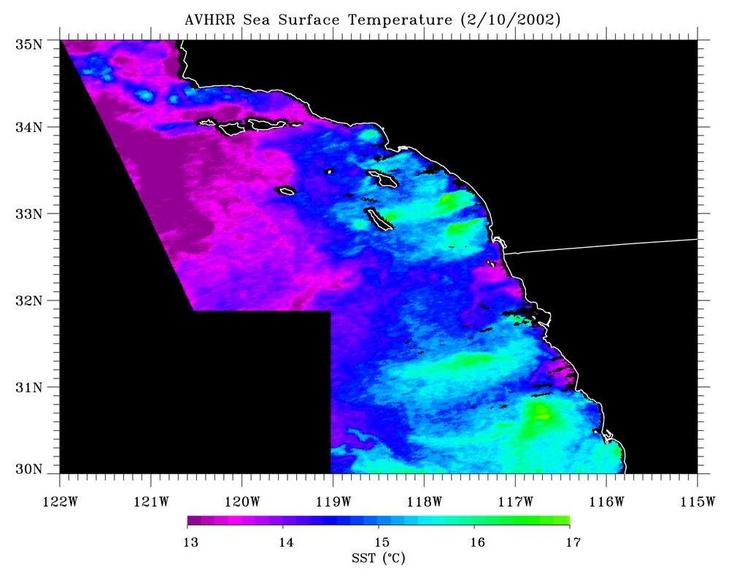
Figure 2. Sea surface temperatures measured at 20:38 UT on February 10,
2002 from AVHRR at 1.1-km resolutions. Black areas over the ocean
represent missing data due to clouds or data not available from NOAA
CoastWatch regions.
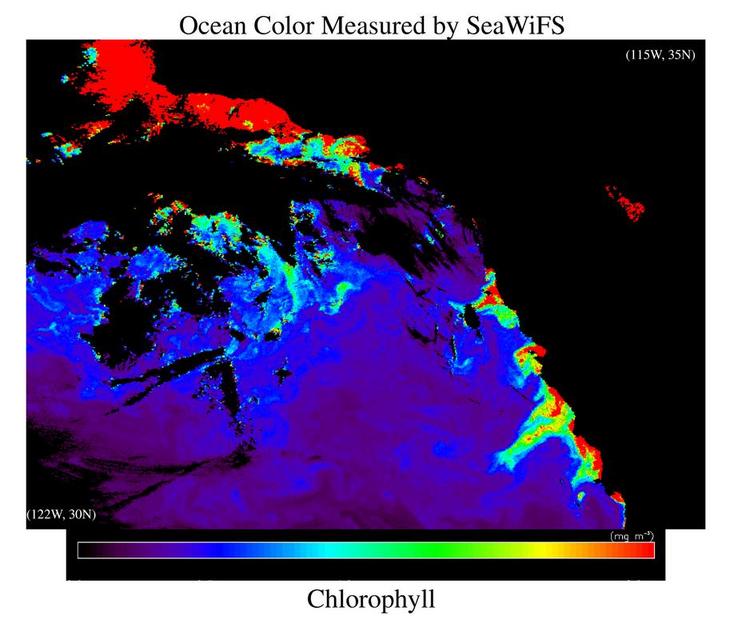
Figure 3. Ocean color chlorophyll data at 1-km resolutions from SeaWiFS
HRPT HUSC station. The data were obtained at 20:00UT on February 12,
2002, a dust-free and normal wind condition. Black areas over the
ocean indicate missing data due to clouds. The size of the plotted
region is the same as in Figure 2.
Reference:
Hu, H., and W.T. Liu, 2003: Oceanic thermal and biological responses in
Santa Ana Winds, Geophy. Res. Lett., 30(11), 1596, doi:10.1029/2003GL017159.
|