
| |||||
|
|
|
|
|
|
|
|
|
|
|
|
|
|
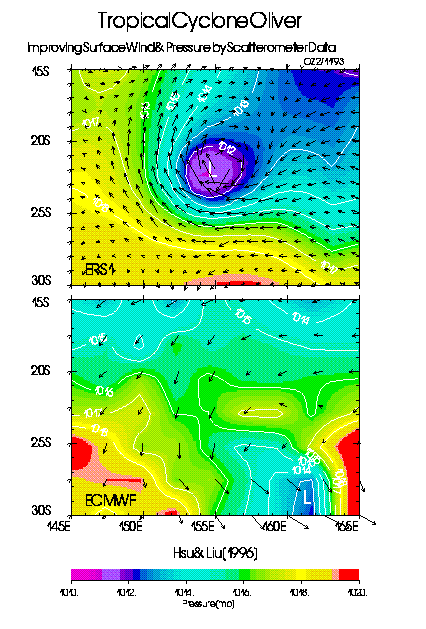
The figure demonstrated that the high spatial resolution of spacebased scatterometer
observations are useful in monitoring the location and intensity of tropical cyclone (also called typhoon
in East Asia or hurricane in N. America). Spaceborne scatterometer can penetrate the cloudy region
around tropical cyclones and resolve the surface wind velocity and pressure field in detail
over data sparse ocean.
This figure shows tropical cyclone Olive during the Austral summer of 1992, located in the
southern tropical Pacific (northest of Australia) where surface observations are sparse.
The bottom figure shows the operational weather prediction products of European Center for
Medium-range Weather Forecast (ECMWF); the color image is the surface pressure field, the arrows
represent the surface wind velocities, and the isobars are in white. In the upper figure, the
surface wind vectors are from ERS-1 scatterometer and the pressure field is derived from the
scatterometer wind field by using the planetary boundary layer model by Brown and Liu (1982) together
with a gradient wind formula. In the ECMWF results, the center of the low pressure is dislocated
from the center of the cyclonic flow. The improvement by the scatterometer observations are obvious.
Details of the results are described in Hsu and Liu (J. Geophys. Res., 101, 17021-17027, 1996).
| PRIVACY | | IMAGE POLICY |
Webmaster: Xiaosu Xie
|