
| |||||
|
|
|
|
|
|
|
|
|
|
|
|
|
|
| NASA space borne sensors help to monitor global climate changes. NASA scientists study seasonal-to-interannual climate anomalies, such as El Niño (explanation), which have far reaching ecological and economical impacts. This home page provides updated information on NASA's contribution in monitoring the evolution of El Niño and its climatic consequences. | |
| Current Status: Fire Up the El Niño Engine | |
 Large picture Fig 1. A picture from CNN shows the fire in Australia, dry weather and brush fire occur in Australia usually during El Niño. |
|
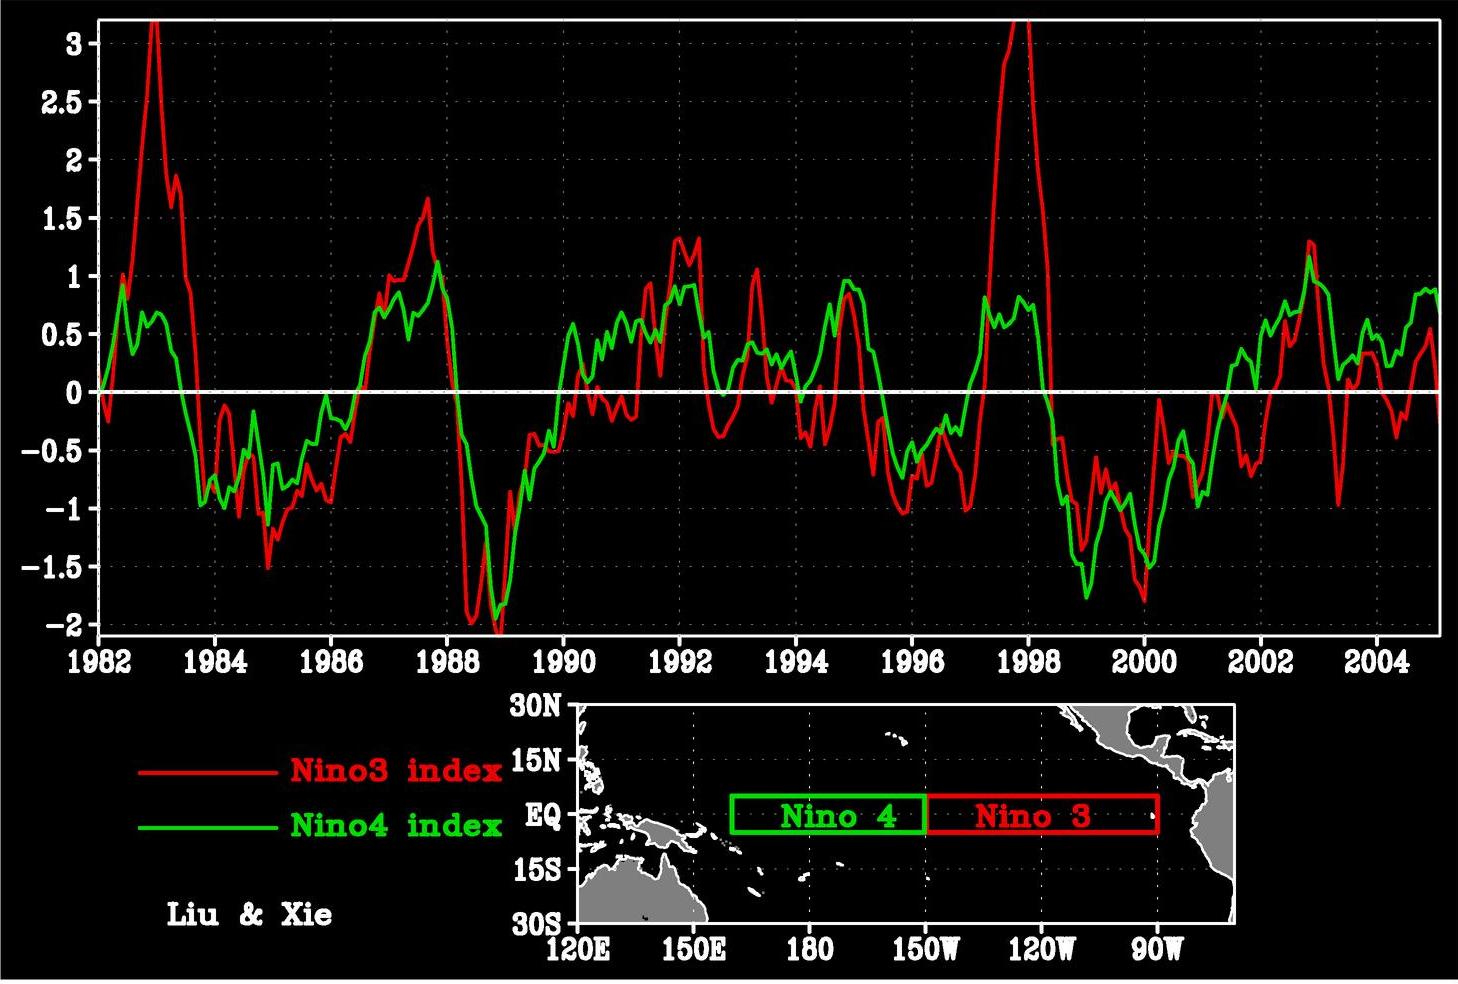
Large picture Fig 2. The figure shows that since the end of the last El Niño in 1998, the equatorial Pacific is cooler than normal. At the end of 2001, however, the central Pacific is 0.5 degree warmer but the eastern Pacific is still cooler than normal. No sign of big Niño. (Nino3 and Nino4 are sea surface temperatures averaged over eastern and central equatorial Pacific respectively, with the long-term mean seasonal cycle removed). |
|
 Large picture Fig 3. The figure shows very strong westerly (blowing from west to east, against the Trade Winds) wind along the equator, spinning twin cyclones to the north and south, just before last Christmas. They are precursors of El Niño. The southern cyclone persisted with the equatorial westerly winds, and give abnormal weather to Samoa, Tonga, and Fiji. |
|
 Large picture Fig 4. The southern cyclone persisted through early part of January, with very strong westerly winds for more than two weeks. |
|
 Large picture Fig 5. This figure compares the surface wind convergence in the December of 2000 and 2001, showing that in last December the convergence zone north of the equator (ITCZ) merged with that south of the equator (SPCZ) and suppressed the cold upwelling water in between; this is an usual indication of El Niño. The 29 degree isotherm outlines the eastern boundary of the Warm Pool. |
|
 Large picture Fig 6. Longitude-time variation of the anomalies of zonal (east-west) component of surface wind and sea level, showing increase activities of westerly winds (positive values) and the eastward propagation of Kelvin waves during the second half of 2001. The 29 degree isotherm is also shown; its eastward movement across the dateline at the equator has also been used as a precursor of El Niño.
|
|
|
Westerly Winds Cause Twin Typhoons and Kelvin Waves - El Nino Brewing? W. Timothy Liu QuikSCAT observed a strong typhoon, Mitag, threatening the Philippines at this moment, in the unusual winter season, and a similar tropical cyclone, Des, passing near the Australian coast towards Nuomea. (Fig. 2, QuikSCAT observations on March 4). These unusual phenomena are results of the westerly winds (blowing from Indonesia towards the American coast) along the equator which started back in February 25, as QuikSCAT revealed. The reversal of the usual Trade Winds (which blow from the American coast towards Asia) generally triggers Kelvin waves and twin cyclones, which are earlier indicators of El Nino. The equatorial westerly winds generate an anticlockwise vortex in the Northern Hemisphere and a clockwise vortex in Southern hemisphere, usually only before strong El Nino (Fig. 1, QuikSCAT obsveratons on Feb. 27). They will also generate Kelvin waves that travel across the entire Pacific and reach the American coast in one to two months. The increase in frequency and strength of the Kelvin Waves may lead to the warming in the east and El Nino. Strong westerly winds and twin cyclones were also observed by QuikSCAT during last Christmas season and the Kelvin wave triggered at that time has just reached South America.
|
|
 Fig 1. Large picture |
|
 Fig 2. Large picture |
|
|
Conclusion:
The El Niño heat engine is being fired up in the west. We still are waiting
to see whether the east will succumb. The east-west battle is on.
|
|
|
Weakening of Equatorial Trade Winds and Subsequent Ocean Warming W.Timothy Liu During the first two weeks of June, QuikSCAT observed the weakening of the trade winds in the equatorial Pacific, which was followed by an unusual warming of the equatorial water, as reflected in the sea level and sea surface temperature anomalies revealed by the Topex/Poseidon altimeter and the microwave imager on the Tropical Rain Measuring Mission. In the figure, wind vectors observed by QuikiSCAT averaged over the 7-days centered on June 8, 2002 are superimposed on sea level observed by Topex/Poseidon averaged over the same period of time. The averages over the same 7-days in 2001, one year ago, were subtracted from the wind vectors and sea levels to show the deviations from normal conditions. Under normal conditions, the trade winds blow from the Americas towards Asia, pushing the surface warm water westward. The surface warm water is replaced by the cold water from below. The figure shows the weakening of the westward trade winds, resulting in eastward anomalies. By the third week of June, both the trade winds and sea level returned to normal. If the weakening continued or intensified, we could have been expecting an El Nino to develop in the near future. |
|
 Large picture |
|
|
To access the daily QuikSCAT wind data, please click here. |
|
|
|
|
| PRIVACY | | IMAGE POLICY |
Webmaster: Xiaosu Xie
|