RESPONSE TO CLOUD FORCING

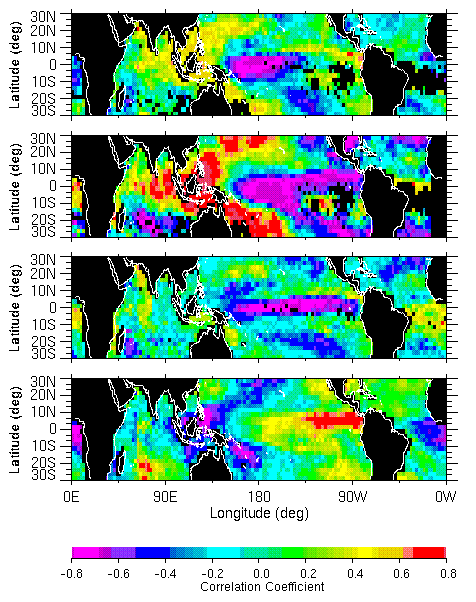
This figure shows the distribution of remote correlation coefficient between the
forcing index of various levels of clouds and sea surface temperature (SST)
averages over an area in the eastern equatorial Pacific. From top to bottom
are for total cloud, high cirrus, middle cloud, and low cloud. The cloud
indexes are derived from ISCCP data and SST is from blended AVHRR data.
The top figure is almost identical with the correlation between SST and surface solar
flux, showing you that surface solar flux is very much governed by
the total clouds produced by ISCCP. The correlation between high cloud
and SST are, to some extent, opposite to the correlation between
low cloud and SST. The correlation between total cloud and SST appears
to be a sum of the effects of various type of clouds. A good example
is in the eastern Pacific just north the equator. In this area, SST
anomalies has a strong negative correlation with the high cloud
and a strong positive correlation with low clouds; the result is
a weak correlation with the total cloud forcing. Detailed
discussion is given by Fu, Liu, and Dickinson (J. Climate, 9, 616-634, 1996).

